
Tick charts are a useful tool for traders seeking a deeper understanding of the market activity. The tick indicator is an MT4 indicator that displays the number of the smallest possible movements by the price on the candlestick chart. These slight price movements, also known as price ticks, can provide valuable insights into institutional activity and market volatility.
How does the tick indicator work in mt4?
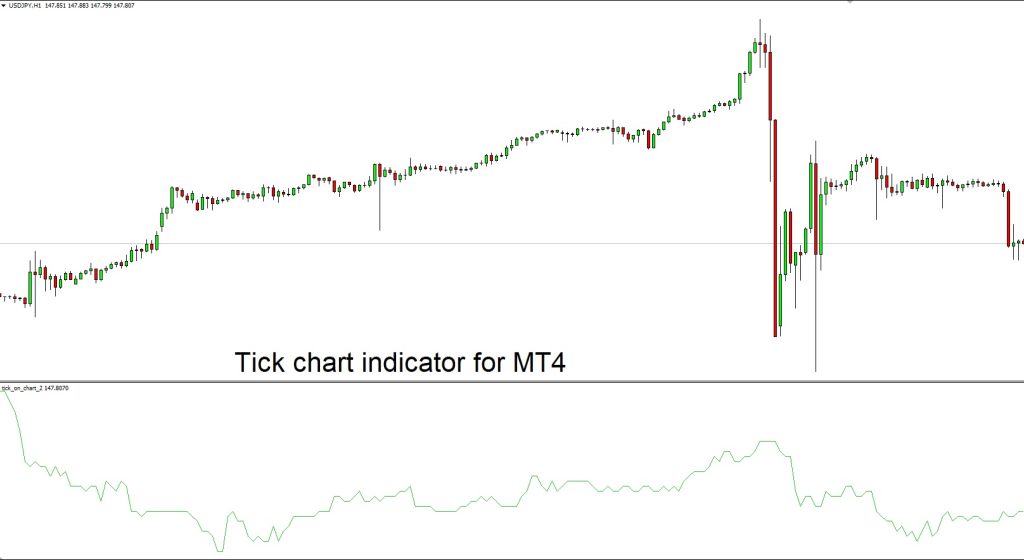
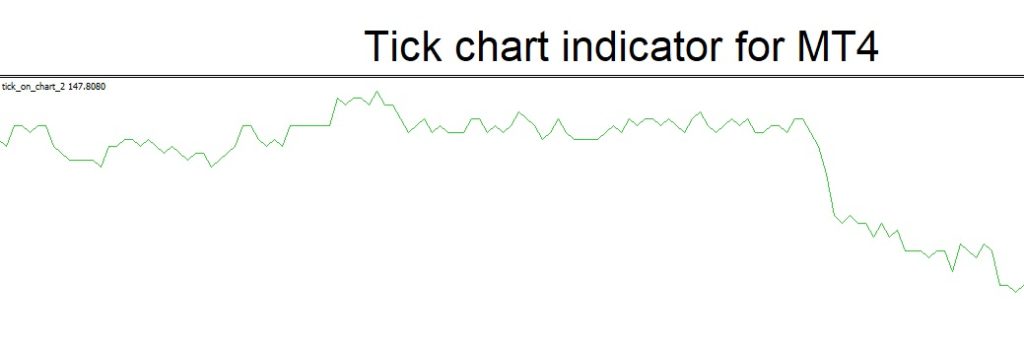
By default, MetaTrader 4 does not display tick charts, which is why traders need an external indicator. The tick chart indicator is a separate window that shows the number of ticks in a specific candlestick or timeframe. This indicator also resembles the volume indicator in forex trading. It measures the number of ticks in a specific time interval, providing insight into the volume of executed trades.
Traders can use the tick chart indicator to identify trends and make informed trading decisions. To use the tick chart indicator, traders must determine whether the trend is bullish or bearish. Once the trend has been identified, traders can open buy or sell orders according to the direction of the significant trend. Additionally, the indicator can be used to identify market volatility and institutional activity, allowing traders to make informed decisions and capitalize on market opportunities.
Read More Support Resistance Indicator (Barry) FREE Download
The bottom line
The tick chart indicator is a simple yet powerful tool that can help traders understand market activity and make more informed trading decisions. The indicator is available for the MT4 platform and has a small file size of 13.7 KB, making it easy to download and install. If you want to gain an edge in your trading and gain insight into market activity, consider using the tick chart indicator in your trading strategy.
[…] Oracle Direction MT4 forex indicator is placed at the bottom of this post. Once you’re done, your mt4 trading chart should look similar to the examples […]