
This Indicator was done and submitted by Kishore M. it is responsible for displaying a line whose color changes from blue to orange. This Indicator is a result of complex programming that does not involve any of the common indicators used in financial markets today, such as the MACD, RSI, or moving averages. The Auto Forecast Expert Indicator adapts itself to current market conditions using complicated algorithms based on price action and custom indicators. The Indicator will give you trading signals Buy or Sell. The in Indicator also displays where to place your stop loss via a pop-up alert window and the chart. The stop-loss levels are indicated by drawing a colored line on the main trading chart.
However, even if the Indicator is made of a complex program algorithm, it is straightforward when it comes to using it. You wait for the Indicator to give you the signals, and your work will be pressing the buy or sell when you get a signal.
The Indicator is made for using time frames that are higher than the 5-minute Timeframe. It would be best if you never used this Indicator within the 5-minute Timeframe since it is precarious. The Indicator is also designed in such a way that it is suited to trading all the currency pairs.
The Indicator is responsible for displaying a signal alert pop-up window. This window prints different kinds of information, including Trend direction: TREND UP or TREND DOWN, Entry price, Pair, Buy or Sell signal, Stop loss level, and Timeframe (on which received chart signal).
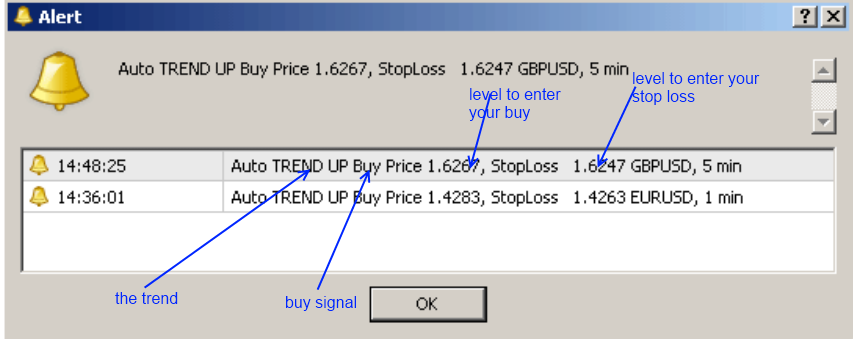
Fig.1. The signal alert pop up window.
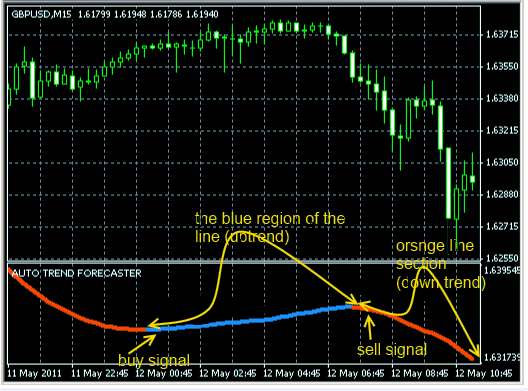
Fig.2. Showing what the Auto Forecast Expert Indicator looks like when loaded on the trading chart.
When trading using this Indicator, there is some important information that you should know. One of these is identifying a long-term trend. If you are used to trading using the 1-hour time frame, load the 2-hour Timeframe and look at the trend. This is usually important since the Indicator will only show you the trend of the current Timeframe throughout the day and will not show that of the other time frames. When you get this trend, as a trader, you should ignore all the signals that will give centrally to your higher time frame trend (global signal).
Then the trader should not trade when the market price trend is sideways. During this time, the market is stagnant and not decided on the trend, and once you open a position, you may end up making a loss if the market chooses to move in the opposite direction.
Placing trades (opening positions) using the Auto Forecast Expert Indicator.
The signals of this Indicator are the color changes. The blue color shows an uptrend, while the orange color shows a downward trend. Therefore the signal is when the color of the line changes. For example, if the line was orange and suddenly changed to blue, then there is a buy signal and vice versa.
BUYING: the trader should place a buy when the line color changes from orange to blue.
SELLING: the trader should place a sell order when the line color changes from blue to orange.
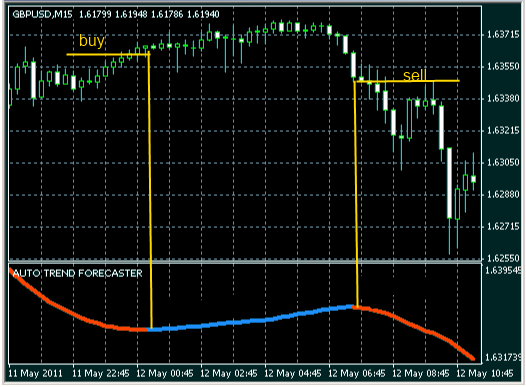
Example of opening trades using this Indicator.
Read More: AI TradeSafe Forex Indicators Free Download
Auto Forecast Expert Forex Indicator Free Download