BB Histogram indicator is a histogram-based forex trading indicator. BB histogram indicator is a straightforward forex trading indicator. BB Histogram can be highly profitable consistently if adequately used. This indicator works best in mt4 trending market conditions and might work poorly in a sideways market. The BB Histogram indicator can be helpful for swing trading and scalping. BB Histogram Forex Indicator works on any time frame more significant than 5 minutes. This forex indicator can be used to trade all the FX markets worldwide.
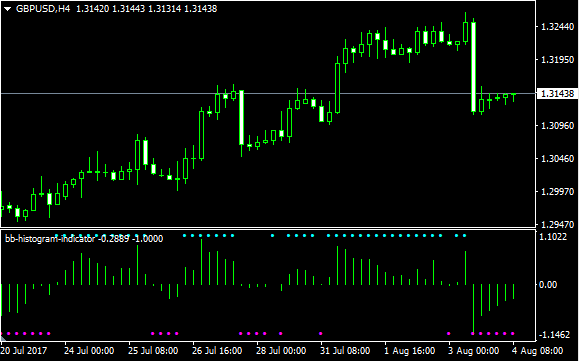
When you install the BB Histogram indicator in your forex trading platform, your chart should look like this:

BB Histogram Forex Indicator
BB Histogram Forex Indicator consists of a histogram and pink and blue dots. When the histogram is positive, it indicates bullish forex market conditions, and when the histogram is in negative territory, it indicates bearish forex market conditions. The blue dots of this forex indicator indicate bullish trading market conditions, and the pink dots indicate bearish market conditions. You are likely to win an FX trade when you place your trade in the direction of a forex trending market. For example, if the market is going up, you should look for buy opportunities only and short opportunities only when the fx market is down trending.
Read More: Acrobat FX 2 Forex Trading Advisor For FREE Download
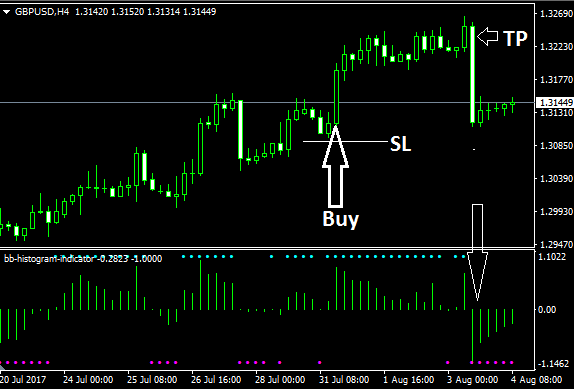
Buying Conditions Using BB Histogram Forex Indicator

- The MT4 market should be up trending.
- The market should be bouncing from the chart recent support.
- BB Histogram indicator should be positive.
- Blue dots should appear above the histogram.
- Place your long position(buy) as soon as the above conditions are met.
- Place your stop loss(SL) below the recent support.
- Take your profit(TP) when the histogram turns negative.
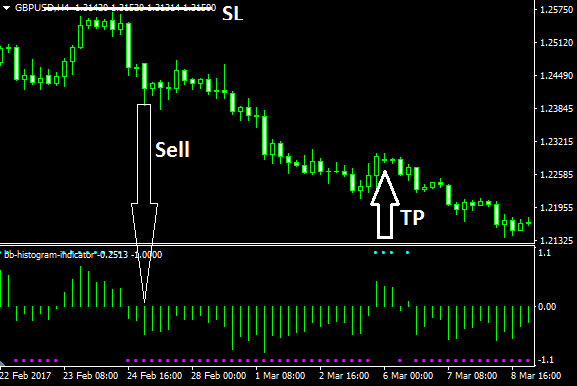
Selling Conditions Using BB Histogram Indicator

- The fx market should be down trending.
- The market should be falling from the chart recent resistance.
- BB Histogram indicator should be negative.
- Pink dots should appear below the histogram.
- Place your short position(sell) as soon as the above conditions are met.
- Place your stop loss(SL) above the recent resistance.
- Take your profit(TP) when the histogram turns positive.
BB Histogram Forex Indicator Free Download


[…] Read More: BB Histogram Forex Indicator Free Download […]
[…] less than 50% of its high-low range. The indicator directly highlights the basing candles using histogram lines (in MT4) or custom candles (in MT5) in the platform’s main chart. Can change The […]
[…] marker providing information on whether the market is choppy or has strong momentum. It consists of histogram bars and dashed horizontal lines separating the flat market from the firm […]
[…] volume indicator based on Williams Percentage Rate. It is developed on the following formula: WPR Histogram Vol = ( WPR + 50) * Volume. For understandable reasons, recalculating overbought and oversold […]
[…] indicator plots the green bullish bar and red bearish histogram bars in a separate window. The trading strategy is to enter the markets based on the appearance of […]