
This is an oscillatory indicator. It is suitable for intraday traders. If the trader clearly understands how to use this indicator and follows it well, they are bound to make at least $99 per day. It is no fit for the forex scalpers since the tighter timeframes of 30MIN and below, the indicator doesn’t give definite entry signals at an increased rate.
The type of entry signal given will vary according to the timeframe you are using. For example, it may provide a buy signal in the H1 timeframe, and if you go to the 15MIN chart timeframe, you get the indicator showing a sell signal. This is because the market prices trend depends on the timeframe you are using, although sometimes it can be the same in all mt4 timeframes. For example, if you use the D1 chart timeframe, the trend is more consolidated, and it is the direction of the prices per day. But within a single day, the market trend may have moved up, down, then up, and then again down, which would be better viewed when a lower chart timeframe is used.
Read More: Best Forex Grid EA FREE Download
The working of the OverTrend OSC forex indicator
The OverTrend-OSC forex indicator is made up of bars that oscillate about a neutral/zero line. A black line also follows the bars’ generated and thus oscillates about the zero level. By default, the bars generated are four different colors that include blue, DeepSkyBlue color, Coral, and red. The blue and DeepSkyBlue colors are displayed above the zero level, while the red and the coral are displayed below the zero level.
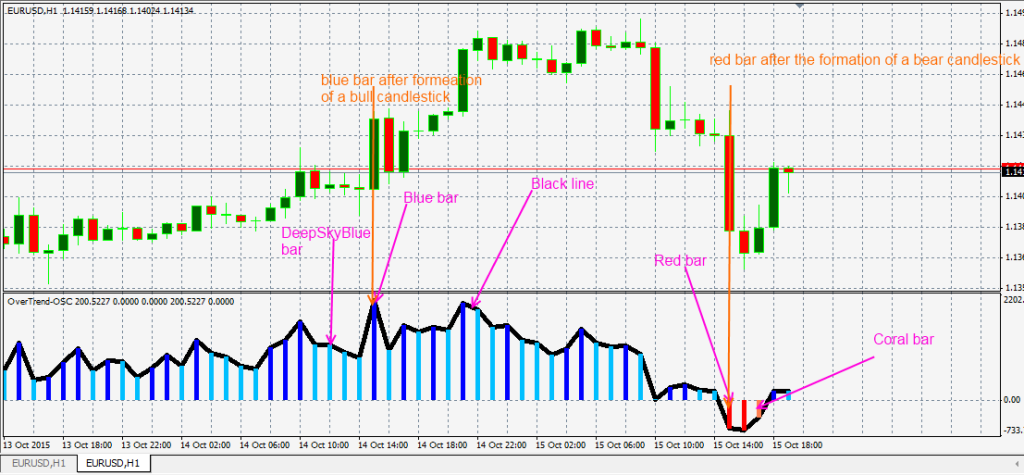
Fig.1. The OverTrend OSC indicator explained.
The main bars that should concern the trader are the blue and the red bars. These two bars are the entry signals for buying and selling, respectively. The blue bars show a continuous rise in market prices, while the red bars show a constant decrease in market prices.
If you look closely at the bars generated by the indicator, you will notice that every bar follows a specific candlestick in the main trading chart. A red color bar is formed when the chart candlestick on the main chart is a bear mt4 candlestick. A coral bar is generated when the chart candlestick formed in the main chart is a chart retracement (a small rise of the market prices after a steep downfall the prices). A blue color bar is generated when a bull candlestick is formed. A DeepSkyBlue color bar is generated when a minor retracement occurs on the market prices.
The length of the chart bars isn’t fixed. It varies depending on the size of the chart candlesticks formed. If you look a bit closely, you will notice that a second blue color candle is only formed when the candlestick is a bull candle.
Using the OverTrend OSC forex indicator to place and close orders
Should only place Orders in the bars generated by the indicator blue or red.
When the indicator generates a blue bar, the trader should place a buy order. When the given indicator generates a red color bar, the traders should place a sell order.
It would be best if you used stops for every trade you place. The take profit should be at 150 points (15 pips) from the order, while the stop loss should be at 200 pips (20 pips).
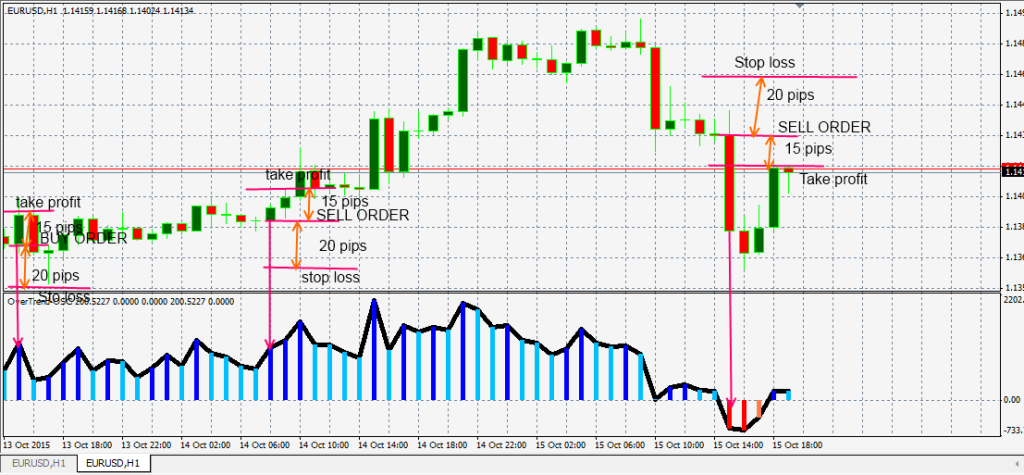
Fig.2. placing orders using the OverTrend OSC forex indicator explained.
As a forex trader, you should not place another order when the current market trade has not yet closed.
OverTrend OSC Forex Indicator Free Download